Altitude sets the headroom
Median roof capacity used by PV and snow on homes rose from 51% below 50 m altitude to 96% at 150 m and above; on commercial roofs from 61% to 92%. Roof snow load on homes more than doubled over the same range.
Open Dataset · Record level · Free to cite
1,568 roof planes on 651 UK buildings and homes, assessed for rooftop solar PV between 1 January and 19 September 2026. One record per roof plane: roof form, covering, fixing method, snow and wind actions, the share of roof capacity the array uses, the verdict and, for commercial buildings, visible condition. Every record is published on this page, in full. No form, no email.
of commercial buildings showed a visible roof condition issue in their survey photographs
median roof capacity used by PV and snow on homes above 150 m, against 51% below 50 m
of fibre cement roofs showed a visible issue, against 51% of profiled metal
of commercial roofs used 90% or more of their capacity once PV and snow were combined
of homes with a recorded covering were concrete tile; 27% natural slate
From the survey record
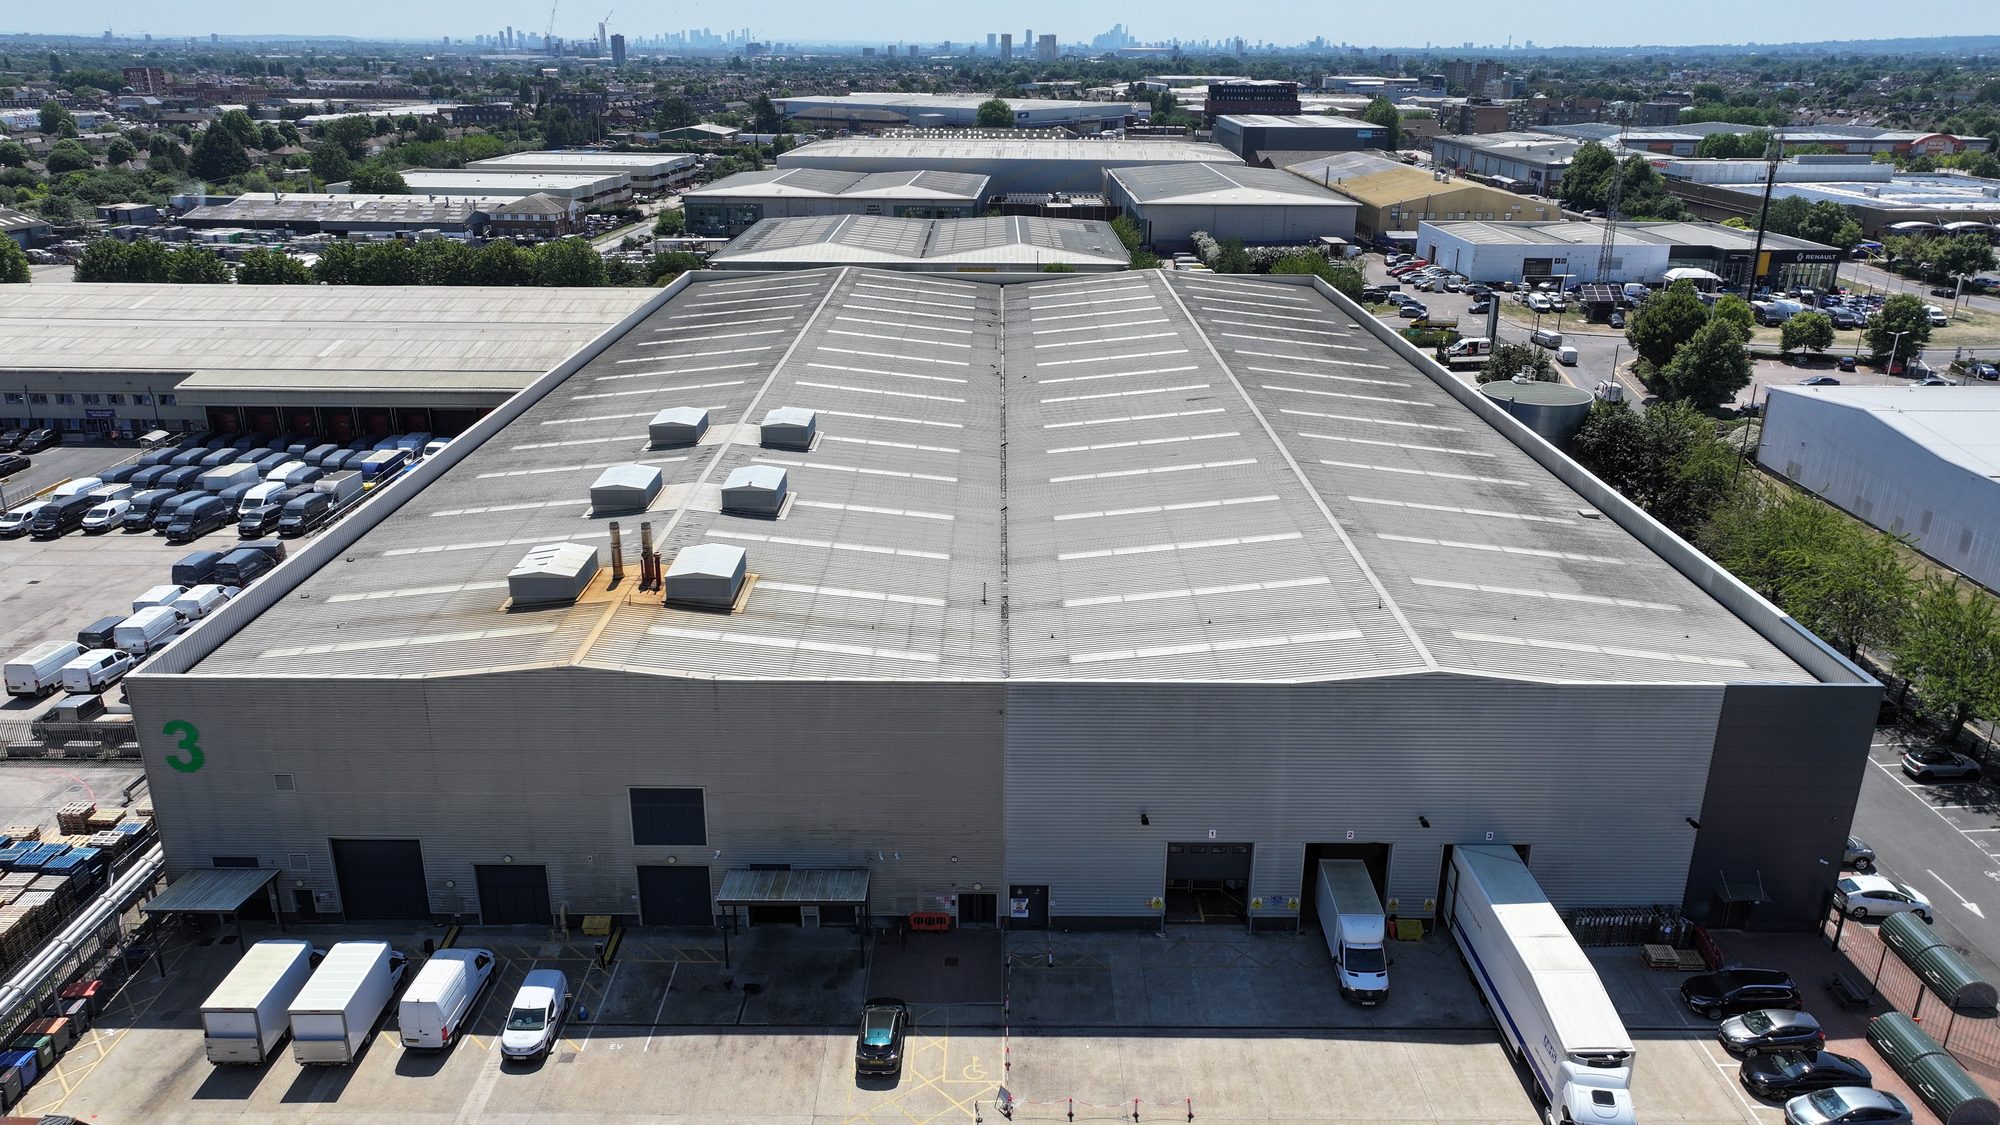
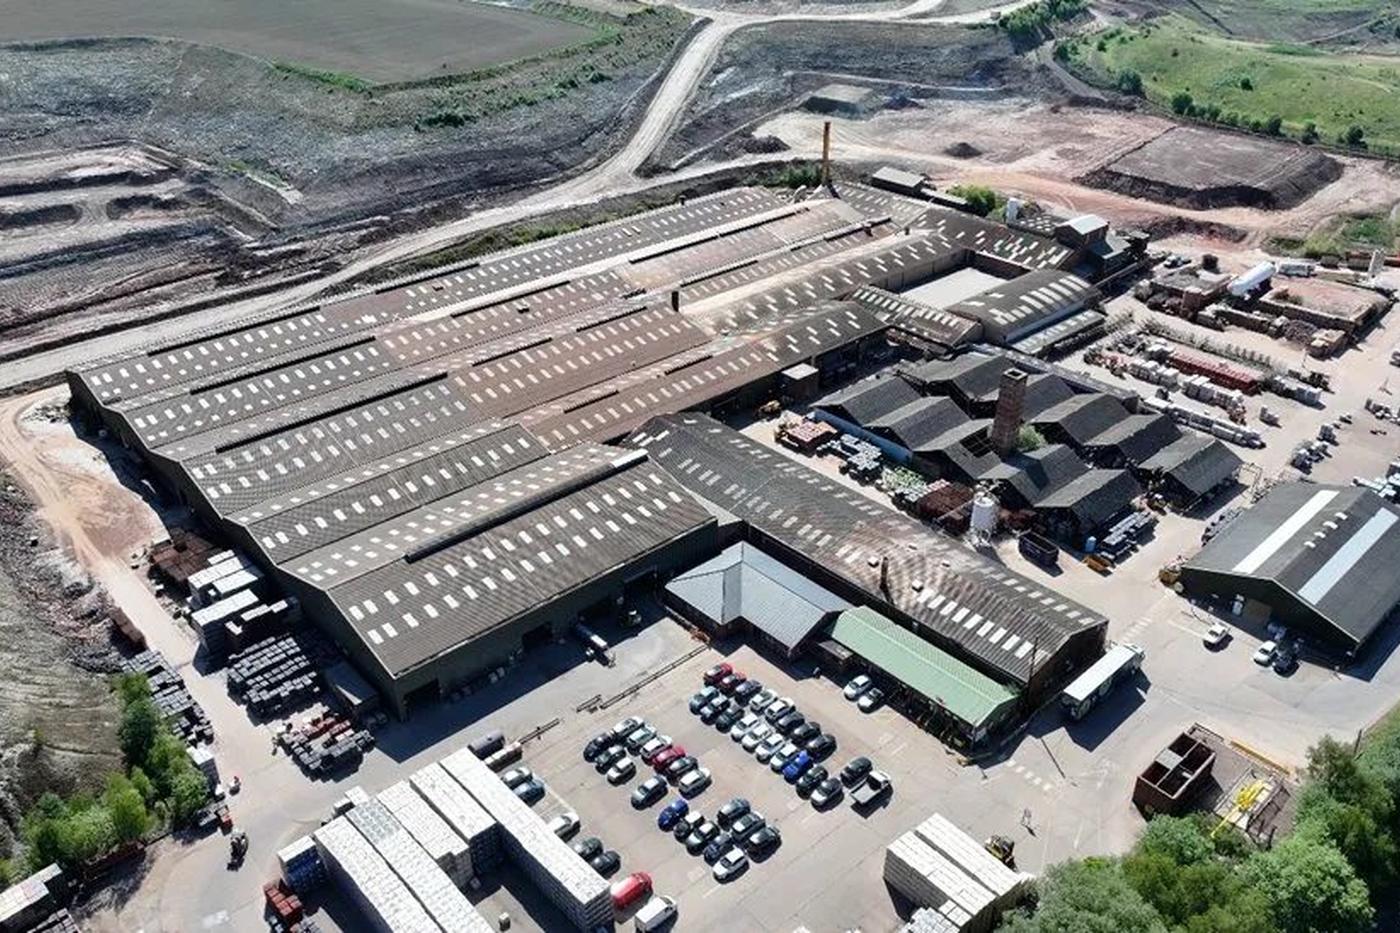
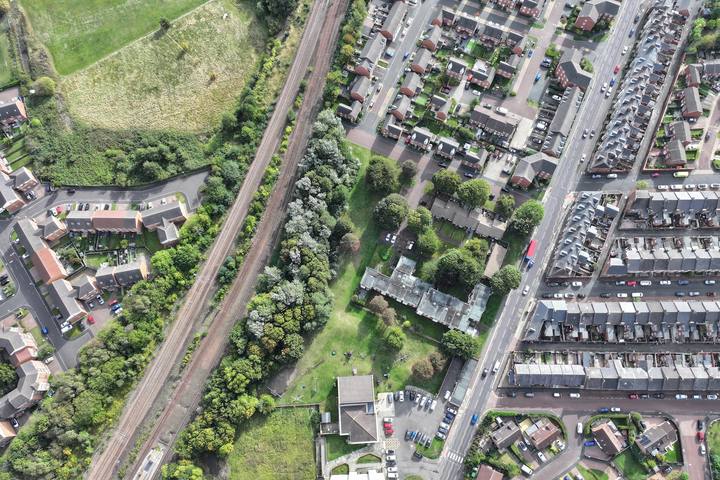
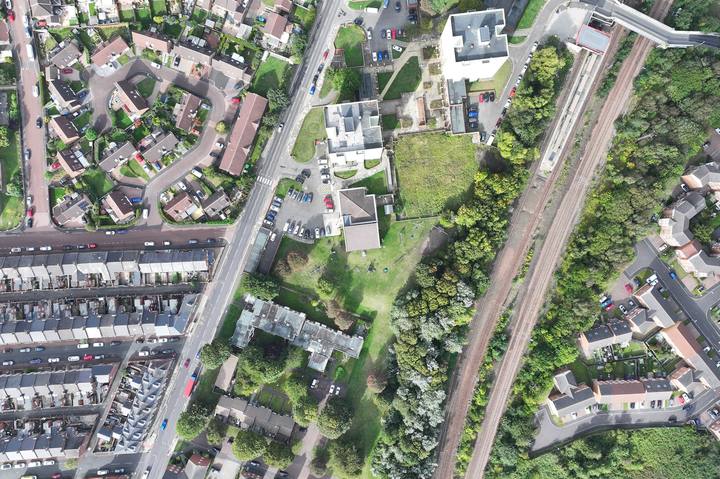
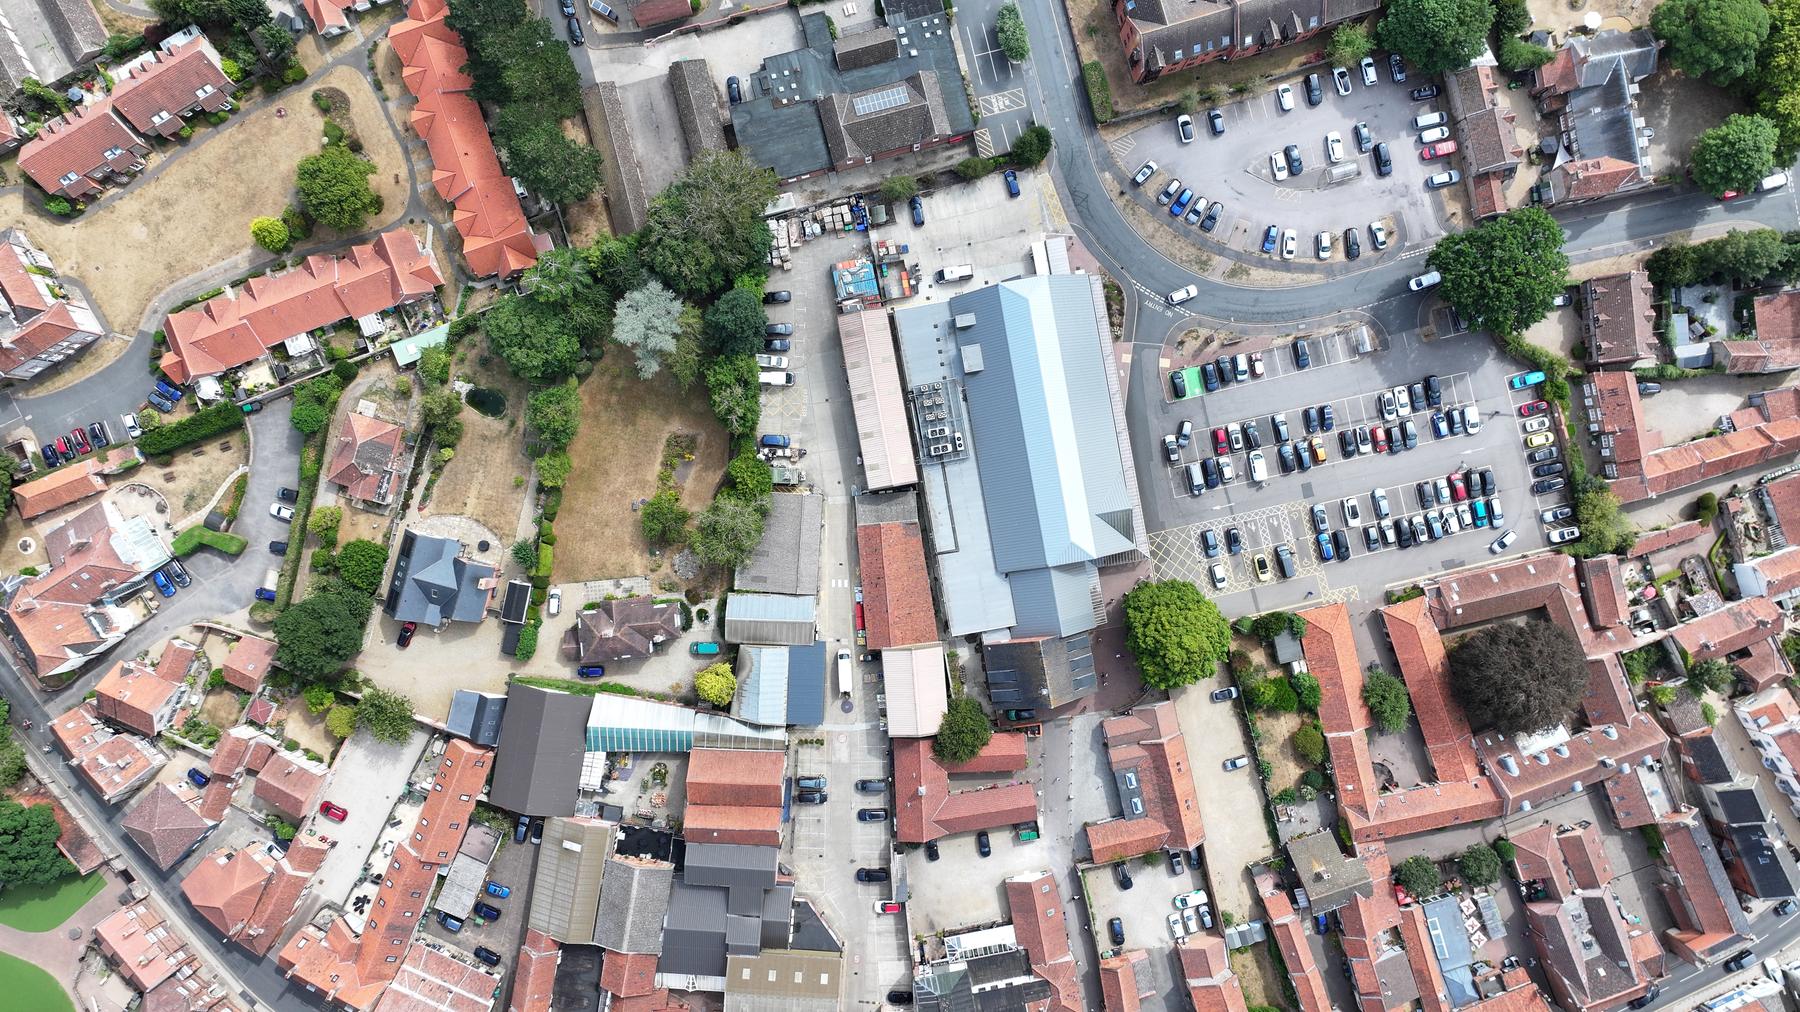
Every photograph here was taken by our own engineers and drone pilots on the surveys behind this dataset: social housing streets, community buildings, historic mills, stadiums and industrial works. Each roof was broken down plane by plane.
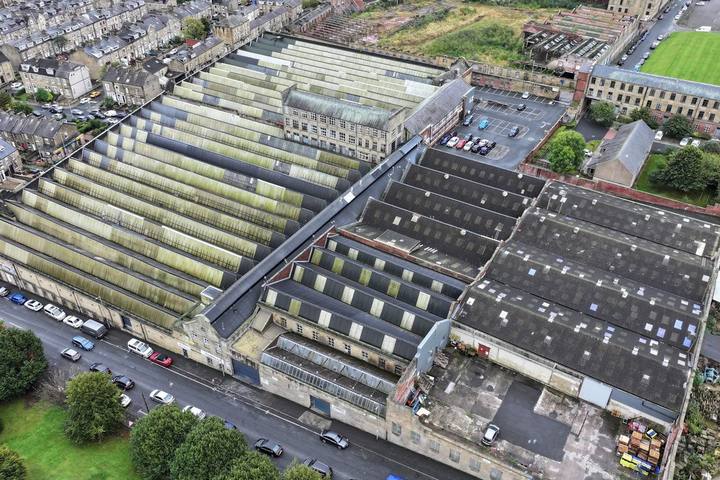
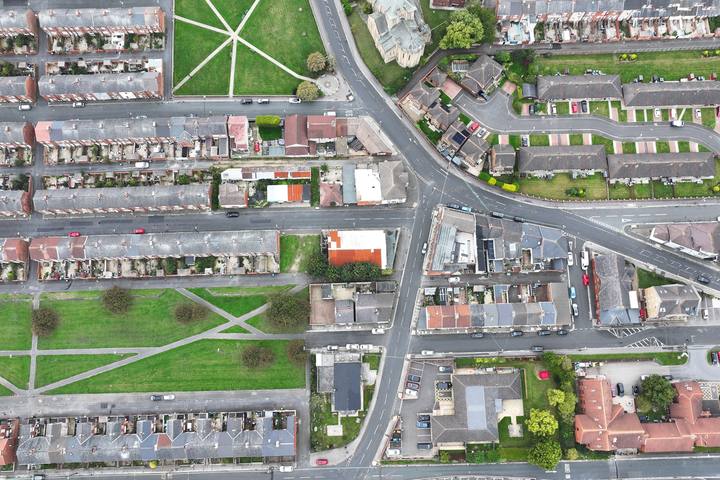
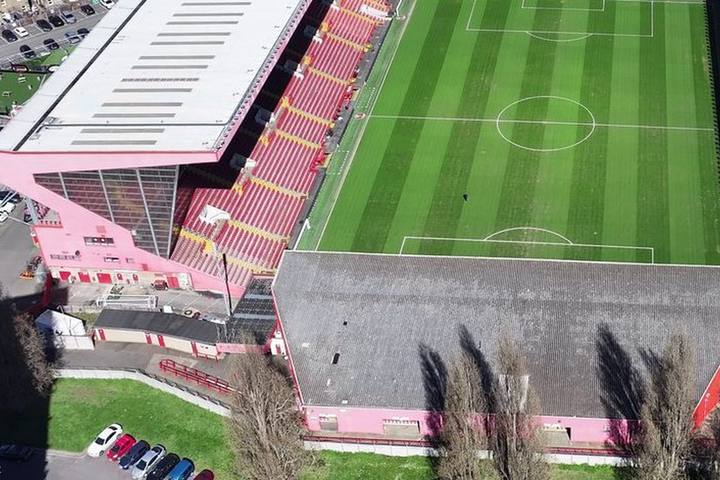
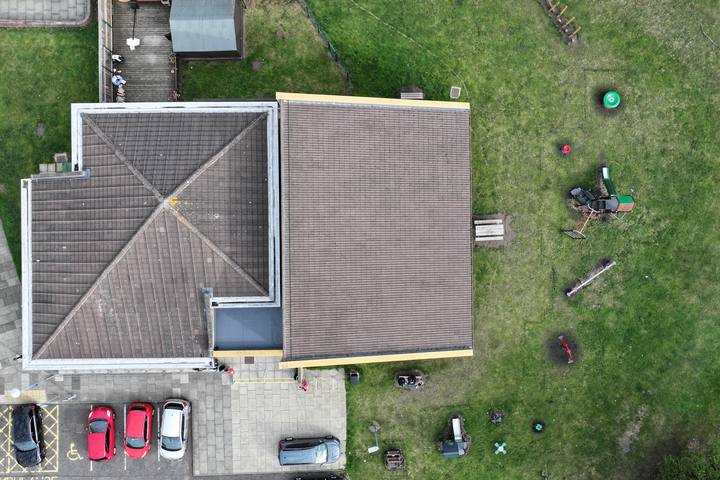
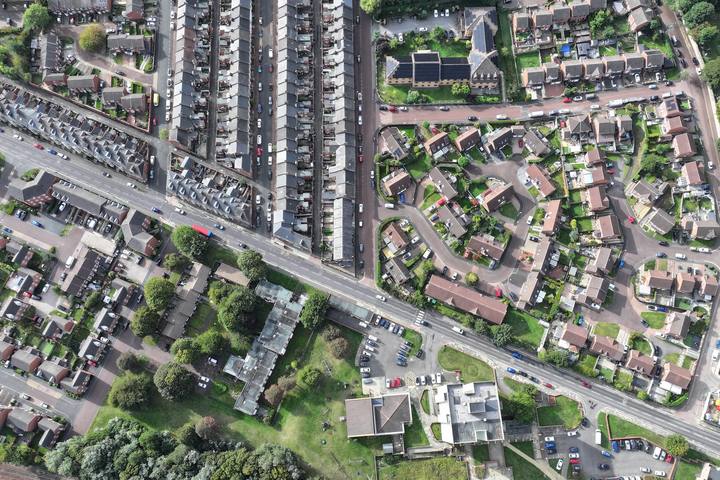
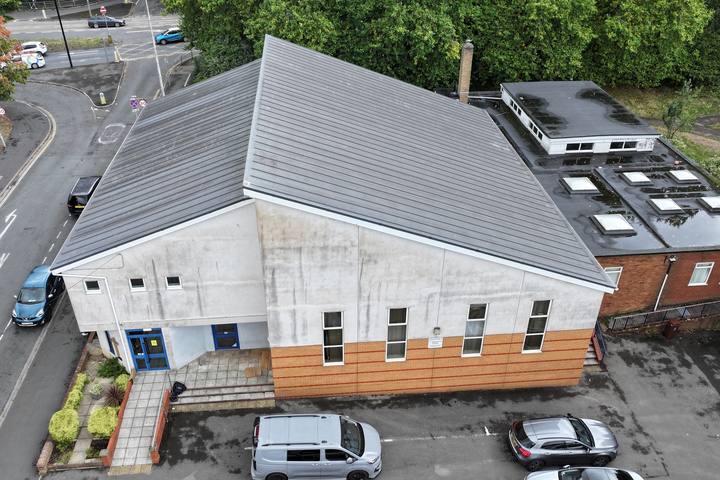
Solar Surveys drone and site photography · sites anonymised
01 · Findings
Each finding carries its sample size so it can be quoted accurately away from this page. The full analysis is in the report.
Median roof capacity used by PV and snow on homes rose from 51% below 50 m altitude to 96% at 150 m and above; on commercial roofs from 61% to 92%. Roof snow load on homes more than doubled over the same range.
A typical array adds 0.13 kN/m²: about 17% of a home’s allowable imposed load and 20% of a commercial roof’s. Snow, not the solar, decides how close a roof runs to its limit.
Of 112 commercial buildings with a stated utilisation, 20 used 90% or more of their capacity. Faith and community buildings and schools reached it most often, 36% of each.
A visible issue was photographed on every natural slate roof recorded, 93% of felt flat roofs and 83% of fibre cement, against 51% of profiled metal and 38% of standing seam.
Roofs with a visible condition issue used a median 75% of capacity; roofs without, 73%. A roof can pass its loading check and still need the covering repaired before an array goes on.
Thirty buildings with six or more planes are 21% of the 145 commercial buildings but carry 295 of their 553 roof planes.
Roof coverings
Tile, slate, pantile, standing seam, profiled sheet, fibre cement and felt. Covering decides how an array is fixed, what load the roof already carries and whether it can be walked on at all, so it is recorded for every plane.
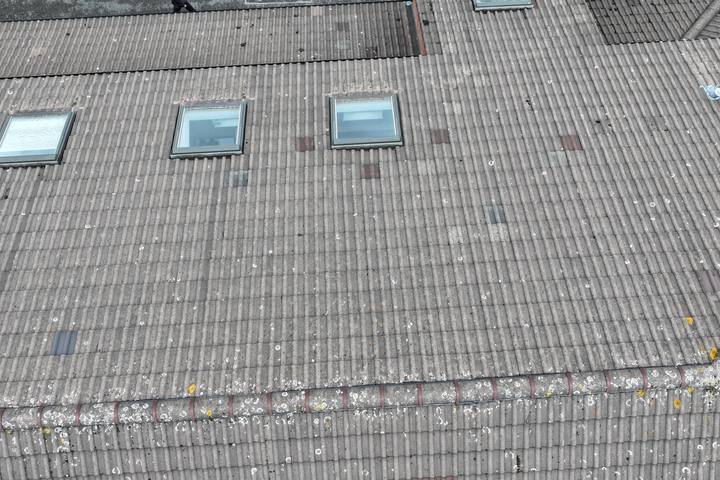
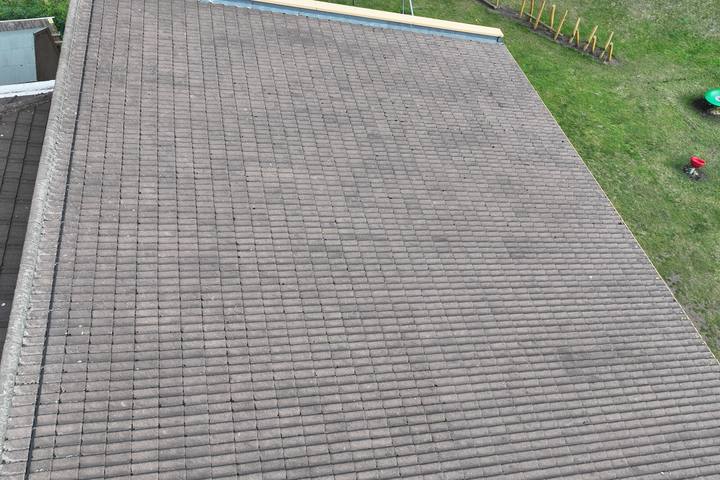
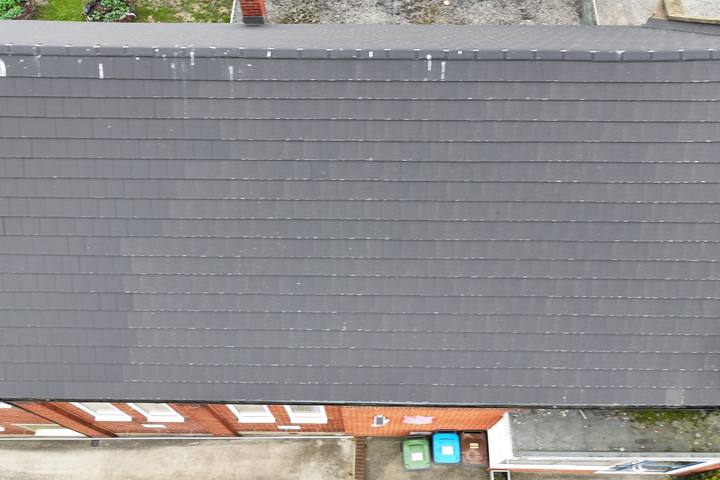
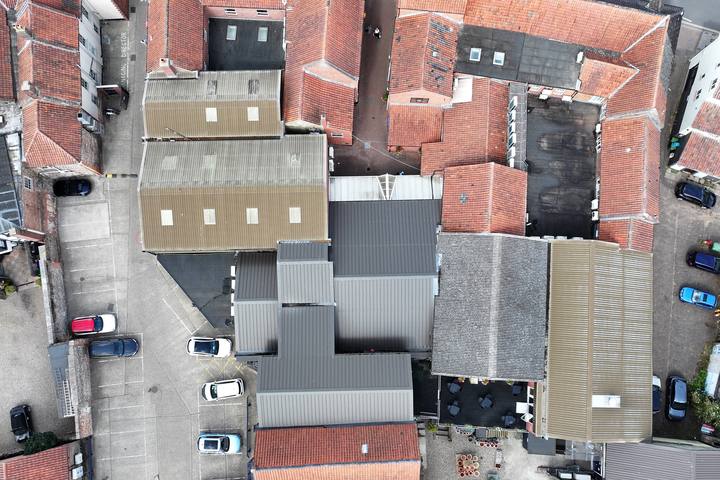
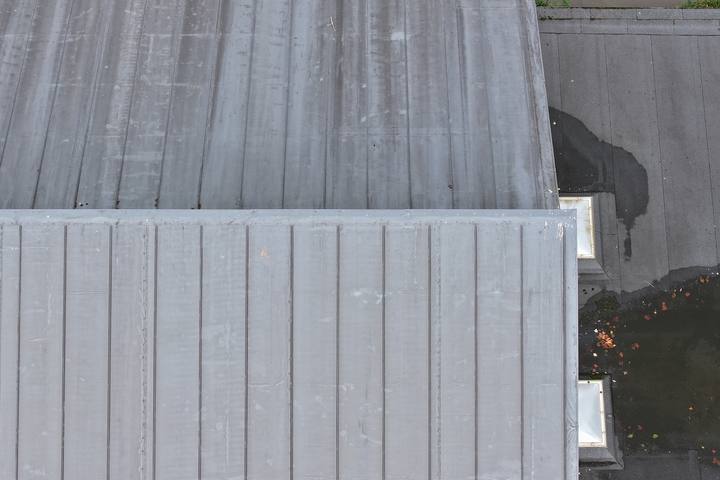
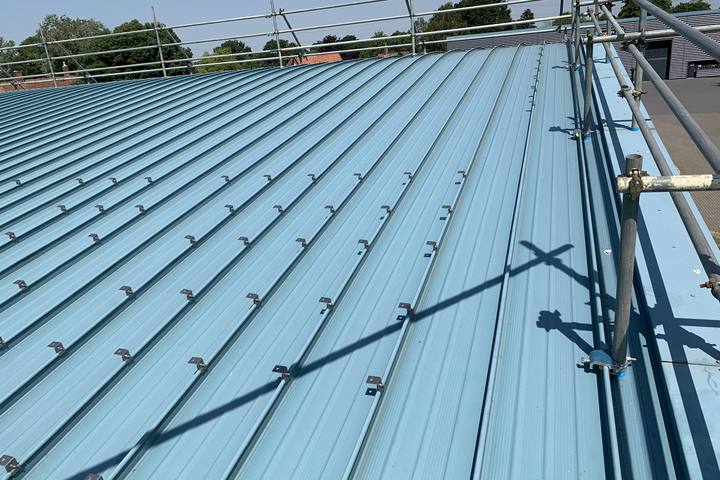
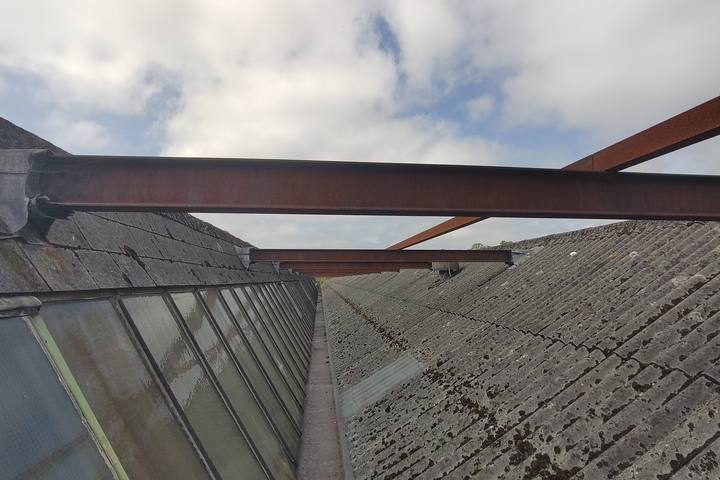
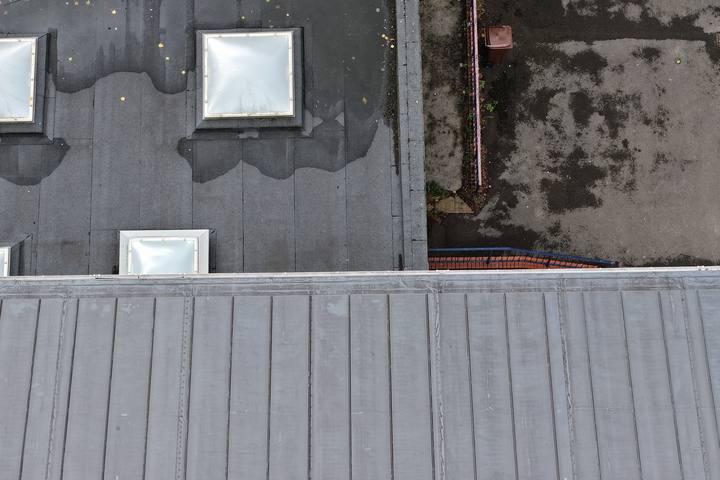
Photographed from above by drone and at roof level on survey
02 · Composition
Shares are of buildings or dwellings where the field is stated. A building can carry several coverings, so the shares within a chart do not sum to 100%.
03 · Loading and capacity
Capacity used is the governing combination of PV and snow load as a share of the roof’s factored allowable imposed load, taken from each report’s own calculation. What remains is the roof’s headroom.
| Median value | Commercial | Homes |
|---|---|---|
| Roof pitch | 20° | 35° |
| Site altitude | 61 m | 83 m |
| Ground snow load, sk | 0.45 kN/m² | 0.54 kN/m² |
| Design roof snow load | 0.40 kN/m² | 0.47 kN/m² |
| Peak velocity pressure, qp | 0.75 kN/m² | 0.80 kN/m² |
| PV array load | 0.13 kN/m² | 0.13 kN/m² |
| Allowable imposed load | 0.60 kN/m² (92%) | 0.75 kN/m² (90%) |
| PV load as share of allowable | 20% | 17% |
| Capacity used by PV and snow | 71% | 67% |
| Array size | 62 kWp · 110 modules | 8 modules |
Medians of buildings where the report states the value. Figures in brackets are the share of buildings at that allowable load.
04 · Condition
109 commercial buildings (473 roof planes) recorded from the survey photographs in each report. This is visible condition, not a condition survey: “not seen” means not visible in the photographs, not confirmed absent.
A typical PV array adds about 0.13 kN/m², a sixth of a home’s allowable imposed load. What moves a roof towards its limit is the snow the array sits under, and snow rises with altitude. Median capacity used on homes climbed from 51% below 50 m to 96% at 150 m and above, and on commercial roofs from 61% to 92%. Feasibility work that applies a generic snow load, or omits the altitude correction, is therefore systematically optimistic on exactly the sites where there is least headroom to be optimistic about.
Commercial roofs are heterogeneous in plane count, covering and form. The median commercial building is simple, but the roof area is concentrated in the complex ones: one building in five carries more than half of the commercial roof. Those are the buildings where a building-level screen, quotation or desktop tool is least reliable, because it scores the whole roof once.
Natural slate, felt and fibre cement show visible issues far more often than modern profiled metal and standing seam. The covering is not the cause in itself. In this sample it marks the older buildings — historic mills, Victorian schools and pre-1980 industrial ranges — and the history of their maintenance. All three buildings graded major carried fibre cement or slate, and each showed deterioration of the supporting steel or timber. Very few reports record a roof’s age or remaining service life, so the covering is the most reliable indicator of it available at portfolio scale.
Roofs with a visible condition issue used almost exactly the same share of their capacity as roofs without one (a median of 75% against 73%). A pass on the loading check is not evidence that the covering will carry an array for its service life, and a sound covering is not evidence of structural headroom. Both have to be established.
Seven of the nine buildings with visible ponding carried felt or bitumen membranes, and 37 of the 42 flat-roofed commercial buildings with a stated fixing method named a ballasted system. Ballast is a permanent dead load. A ballasted array on a flat roof that already holds water is the combination most deserving of site verification.
98% of homes had exactly two roof planes and 97% a duopitch form. The covering, though, changes between neighbouring postcode areas, and so does the headroom: the median home in one North East postcode area used 59% of its capacity, in another 96%, with 87% of homes there at or above 90%. The sample has to be drawn from the right streets, the right house types and the right altitude.
The PV Structural Feasibility Dataset reports that 35% of 575 commercial rooftops needed engineering intervention before PV could proceed. The two are not in conflict, because they measure different things. That study classifies the path to installation, counting a redesigned or rejected layout as an intervention. This one records the verdict in the issued report, after the layout had been revised to what the roof can carry. The share of issued reports that say “suitable” is not the share of roofs that were suitable as first proposed. The gap between the two is the value of the assessment.
The full report
Loading and capacity, snow and wind actions by altitude and region, plane counts by building type, coverings, condition, verdicts and pass rates, housing programmes, discussion, recommendations for installers, asset owners, housing providers and researchers, and the limitations. Free to read and cite.
Download the report (PDF)Beneath the covering
On attended surveys the engineer goes inside: loft voids, roof spaces and open-span halls. Trusses, purlins, rafters and steelwork are measured and inspected, because the covering says nothing about the structure carrying it.
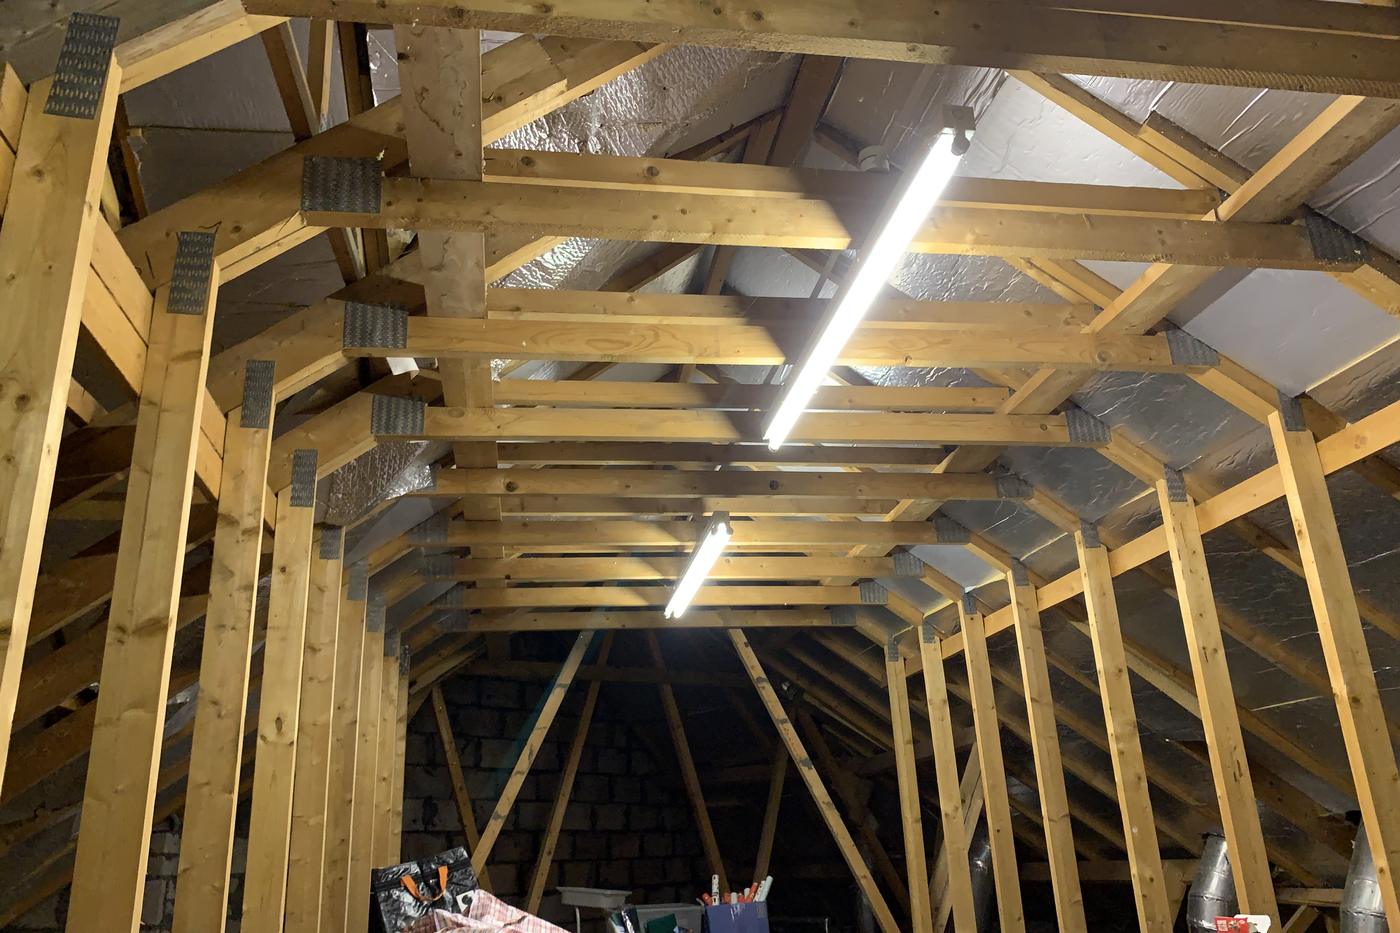
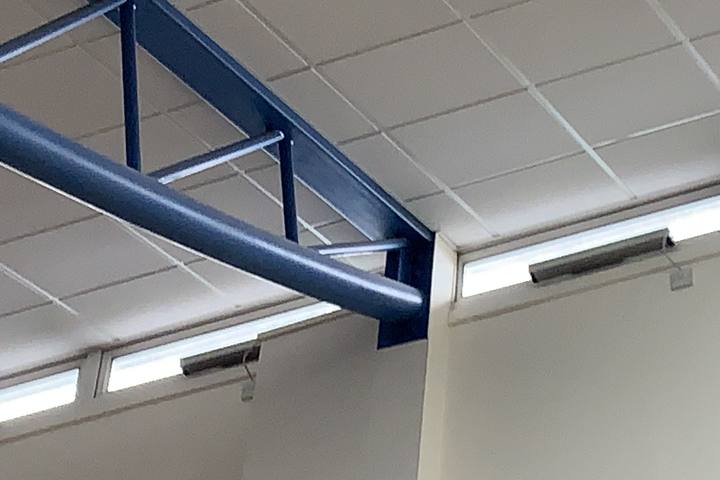
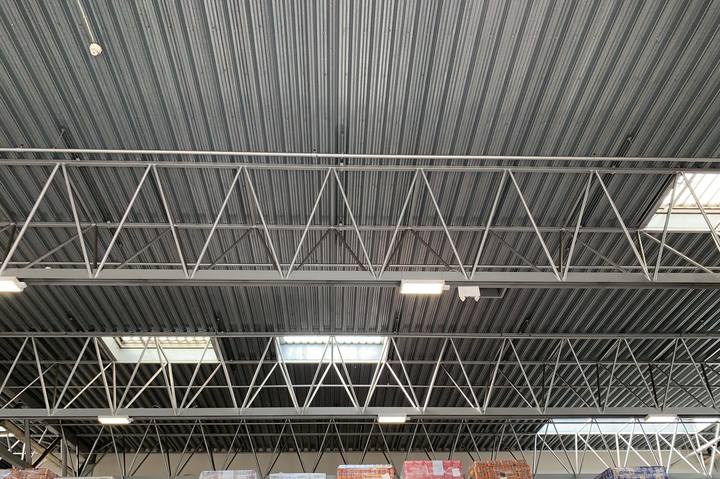
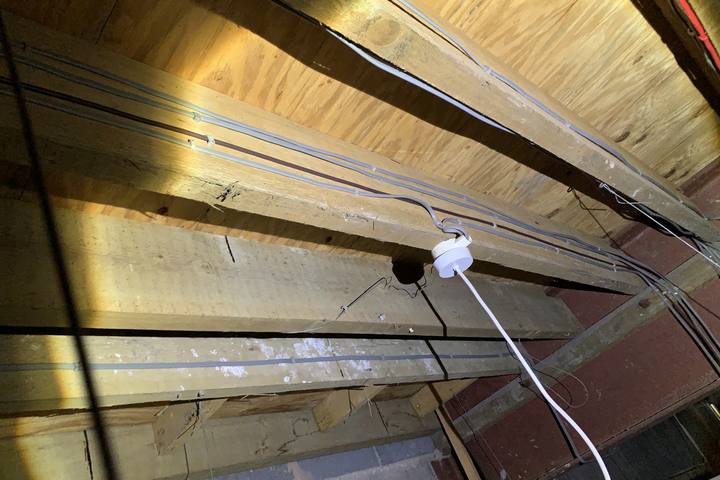
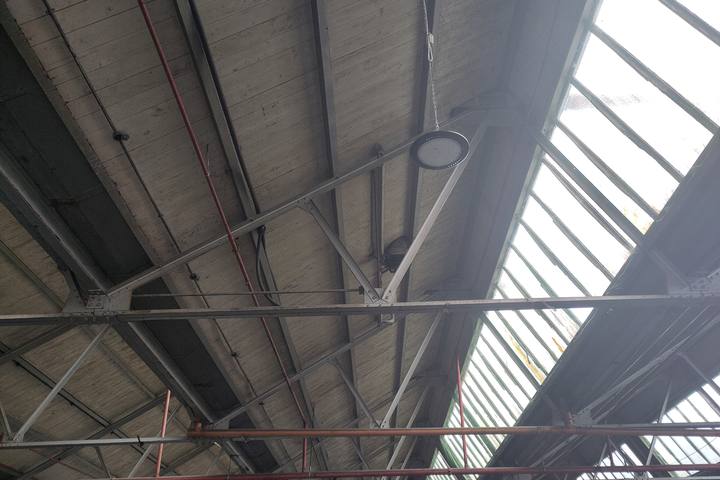
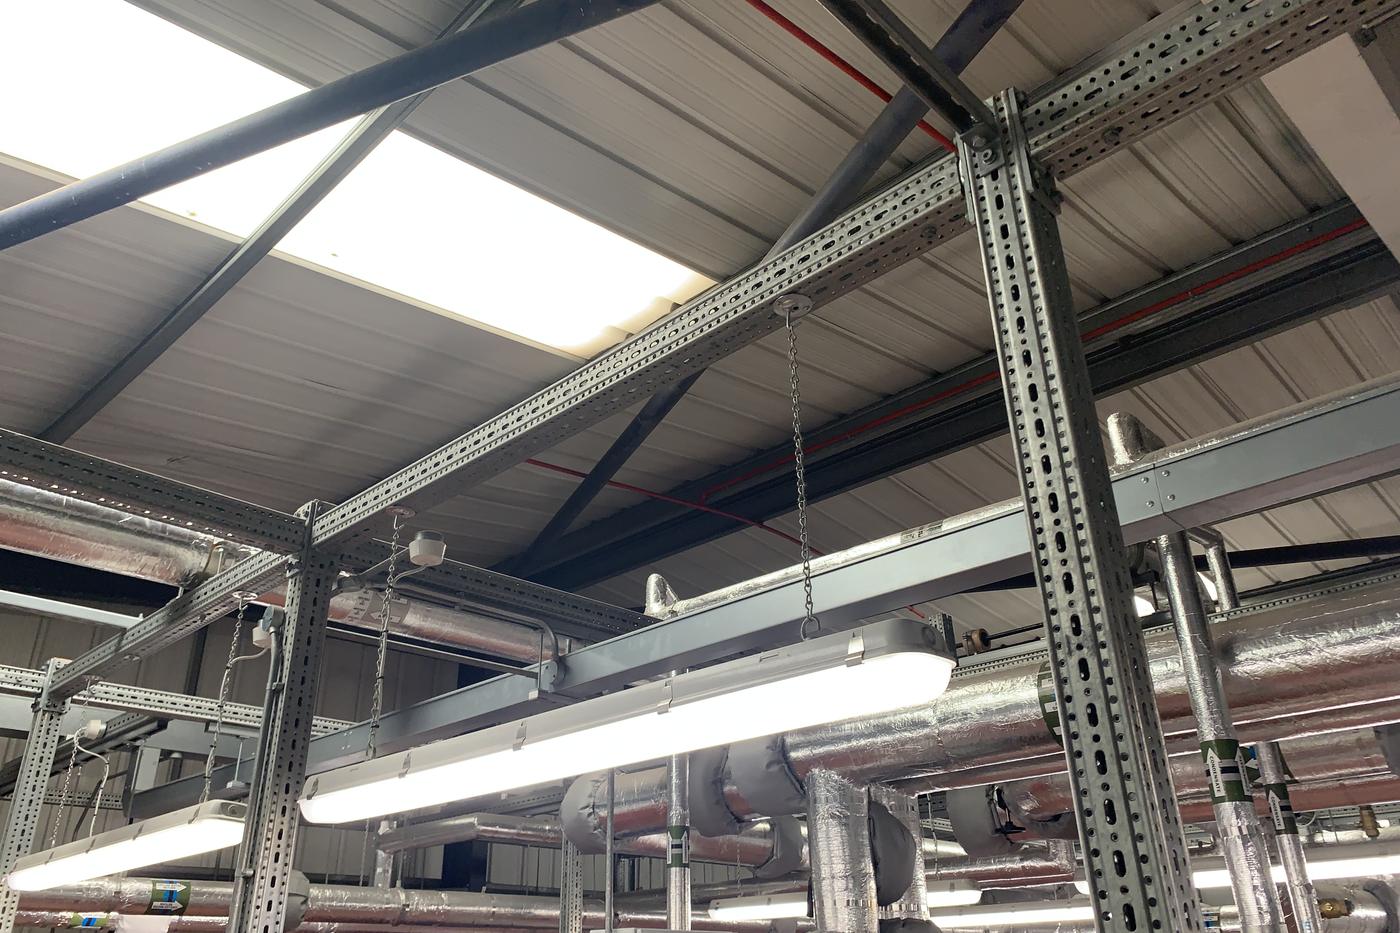
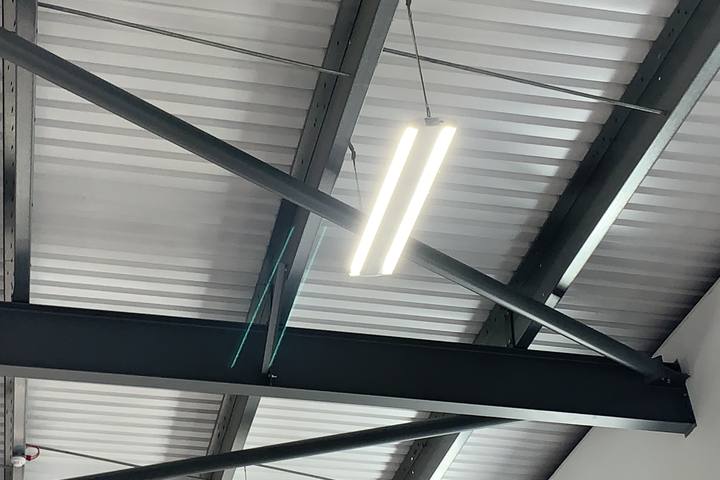
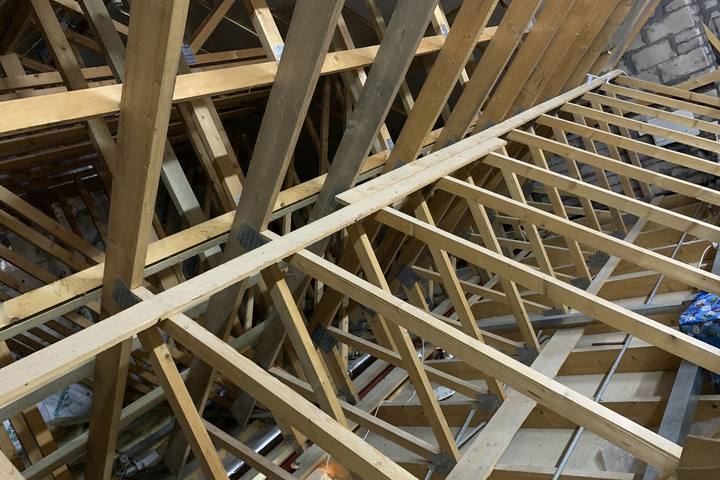
Internal structure photographed on attended surveys
06 · The data
Every building and home in the dataset, one row each. Filter by any combination of fields, search, or select a column heading to sort. Identifiers are random. No client names, addresses, full postcodes or report text are included; location is given to postcode area only.
07 · Method
08 · Caveats
Stated because a dataset without them is not usable evidence.
09 · Use it
Free to cite and to quote with attribution and a link. Republishing the dataset, adapting it or building on it in other work requires written permission from Solar Surveys Ltd — ask, and it is normally given.
Attribution
Solar Surveys Ltd (2026). UK Roof Plane Dataset 2026: 1,568 roof planes assessed for solar PV, 1 January to 19 September 2026. Version 1.0. Sahir Raihan, Managing Director.
https://solarsurveys.co.uk/roof-plane-dataset-2026
The full report is archived with a permanent DOI: 10.5281/zenodo.22850513
This is a separate study from the PV Structural Feasibility Dataset 2026, which reports structural outcomes for 575 commercial rooftops. This dataset records what was on the roof, plane by plane.
© 2026 Solar Surveys Ltd. All rights reserved.
Using the data and want a field explained, or a cut we have not published? Ask. We would rather a number was reported correctly than quickly.
The same assessment is available for your roofs, from a single building to a housing programme.